
Here we will learn about experimental probability, including using the relative frequency and finding the probability distribution.
There are also probability distribution worksheets based on Edexcel, AQA and OCR exam questions, along with further guidance on where to go next if you’re still stuck.
Experimental probability is the probability of an event happening based on an experiment or observation.
To calculate the experimental probability of an event, we calculate the relative frequency of the event.
We can also express this as R=\frac where R is the relative frequency, f is the frequency of the event occurring, and n is the number of trials of the experiment.
If we find the relative frequency for all possible events from the experiment we can write the probability distribution for that experiment.
The relative frequency, experimental probability and empirical probability are the same thing and are calculated using the data from random experiments. They also have a key use in real-life problem solving.
For example, Jo made a four-sided spinner out of cardboard and a pencil.
She spun the spinner 50 times. The table shows the number of times the spinner landed on each of the numbers 1 to 4. The final column shows the relative frequency.
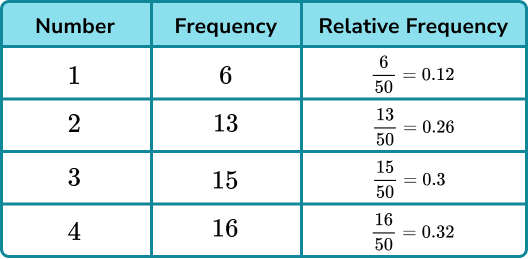
The relative frequencies of all possible events will add up to 1.
0.12 + 0.26 + 0.3 + 0.32 = 1
This is because the events are mutually exclusive.